
AI agent monitoring is the practice of tracking what an AI agent does in production, including every model call, tool call, decision, cost and outcome, and judging whether each task was completed correctly and safely. Observability goes further: it lets a team trace any bad outcome back to the step that caused it. Agents need both because they fail quietly. A loop, a wrong tool argument or an ungrounded answer rarely raises an error, so classic uptime monitoring misses it.
Key Takeaways
- AI agent monitoring must cover five layers: operations, behavior, quality, safety and business outcomes. Classic application monitoring covers only the first.
- The unit of observability for an agent is the trace: one task, broken into spans for each model call, tool call and retrieval step.
- OpenTelemetry’s GenAI semantic conventions define standard span names such as invoke_agent and execute_tool, so traces stay portable across tools, though the conventions are still in development.
- Automated scoring can evaluate every conversation, but it needs regular human calibration to stay trustworthy.
What Is AI Agent Monitoring and Observability?
AI agent monitoring tracks known signals against expected values: latency, error rates, cost, resolution rate and similar metrics. AI agent observability is the ability to explain any individual outcome, including what the agent saw, which steps it took, which tools it called with which arguments, and why it produced the result it did.
Intercom’s Fin team summarizes the distinction for customer service agents: observability answers what happened in each interaction, why it happened and what to fix next. The same idea applies to coding agents, research agents and internal workflow agents. Monitoring tells you something is wrong; observability tells you where.
Why Are AI Agents Harder to Monitor Than Normal Software?
AI agents are harder to monitor because their failures are usually behavioral, not technical. A normal API either returns the right response or throws an error. An agent can return a confident, well-formatted, wrong answer after five successful tool calls, and every infrastructure metric will look healthy.
Non-deterministic paths: the same request can take different routes through tools and reasoning steps.
Multi-step chains: an early mistake, such as a wrong customer ID, propagates through every later step.
Systematic errors: an AI that is wrong is often wrong in the same way across many conversations, so one defect can scale instantly.
Variable cost: a looping or verbose run can cost many times the median, and averages hide it.
Hidden change: a provider model update, prompt edit or data refresh can change behavior without any code deploy.
These risks map directly onto why projects fail. Gartner predicted in June 2025 that over 40% of agentic AI projects would be canceled by the end of 2027 due to escalating costs, unclear business value or inadequate risk controls. Cost, value and risk are exactly the things a production observability layer is built to measure.
What Should You Monitor in an AI Agent?
Monitor AI agents in five layers, from infrastructure up to business outcomes.
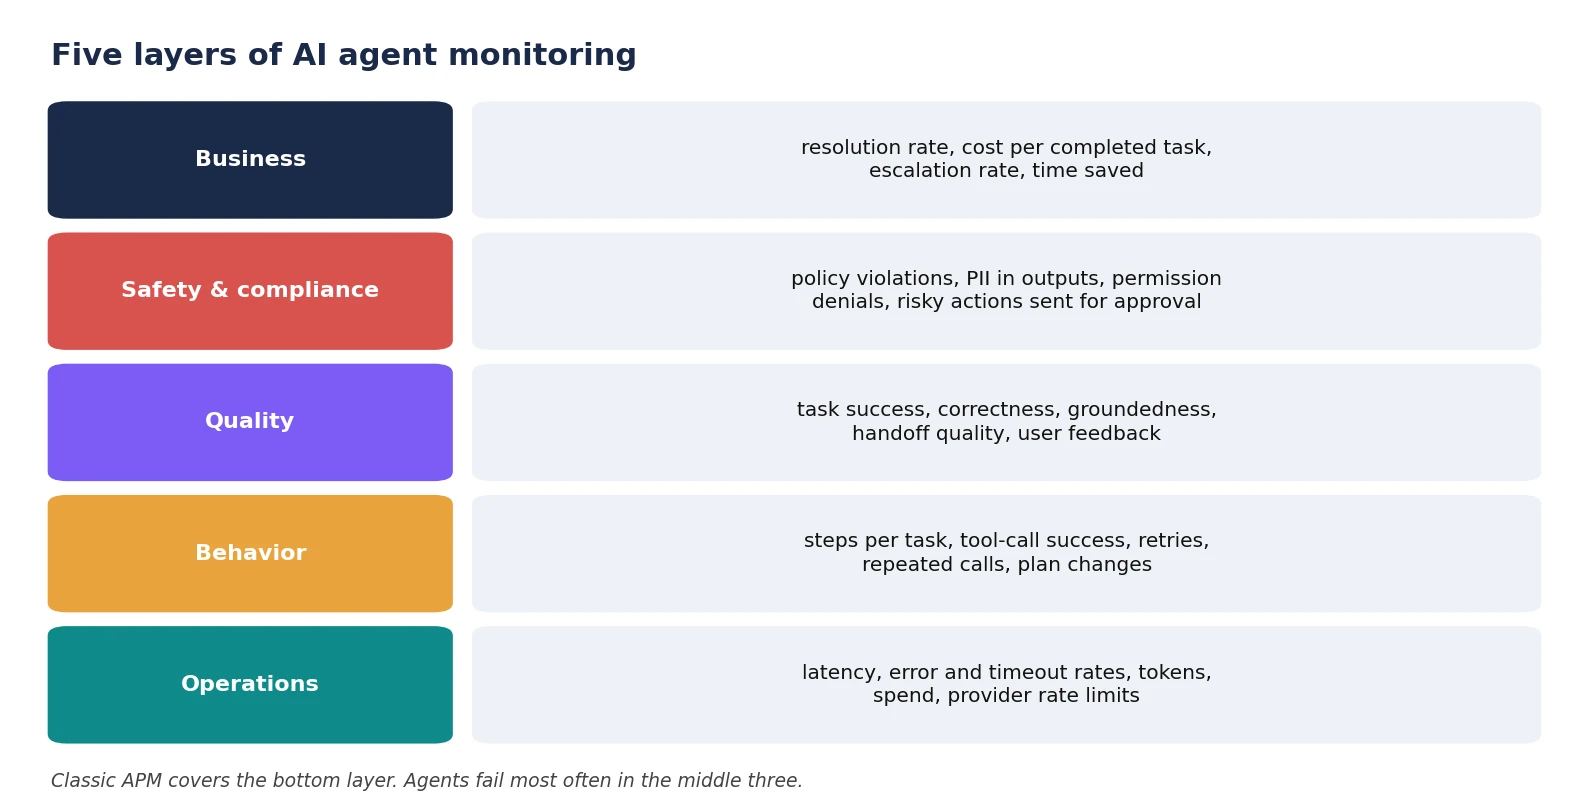
| Layer | Key metrics | What it catches |
| Operations | p50/p95 latency, error and timeout rates, tokens, spend, provider rate limits | Outages, slow steps, budget overruns |
| Behavior | Steps per task, tool-call success, retries, repeated identical calls, plan changes | Loops, wrong tools, bad arguments |
| Quality | Task success, correctness, groundedness against sources, handoff quality, user feedback | Wrong but confident answers |
| Safety and compliance | Policy violations, PII in outputs, permission denials, risky actions sent for approval | Data leaks, over-reach, regulatory exposure |
| Business | Resolution rate, cost per completed task, escalation rate, time saved | Whether the agent is worth running |
Two metrics deserve special attention. First, cost per completed task, not cost per call, because retries and long chains are where agent budgets disappear. Second, resolution quality, not resolution rate alone. A conversation marked resolved that is actually wrong creates downstream cost.
What Does an Agent Trace Look Like?
An agent trace records one complete task as a tree of spans. The root span covers the whole agent invocation; child spans cover each model call, tool execution and retrieval step, with inputs, outputs, timing, tokens and errors attached.
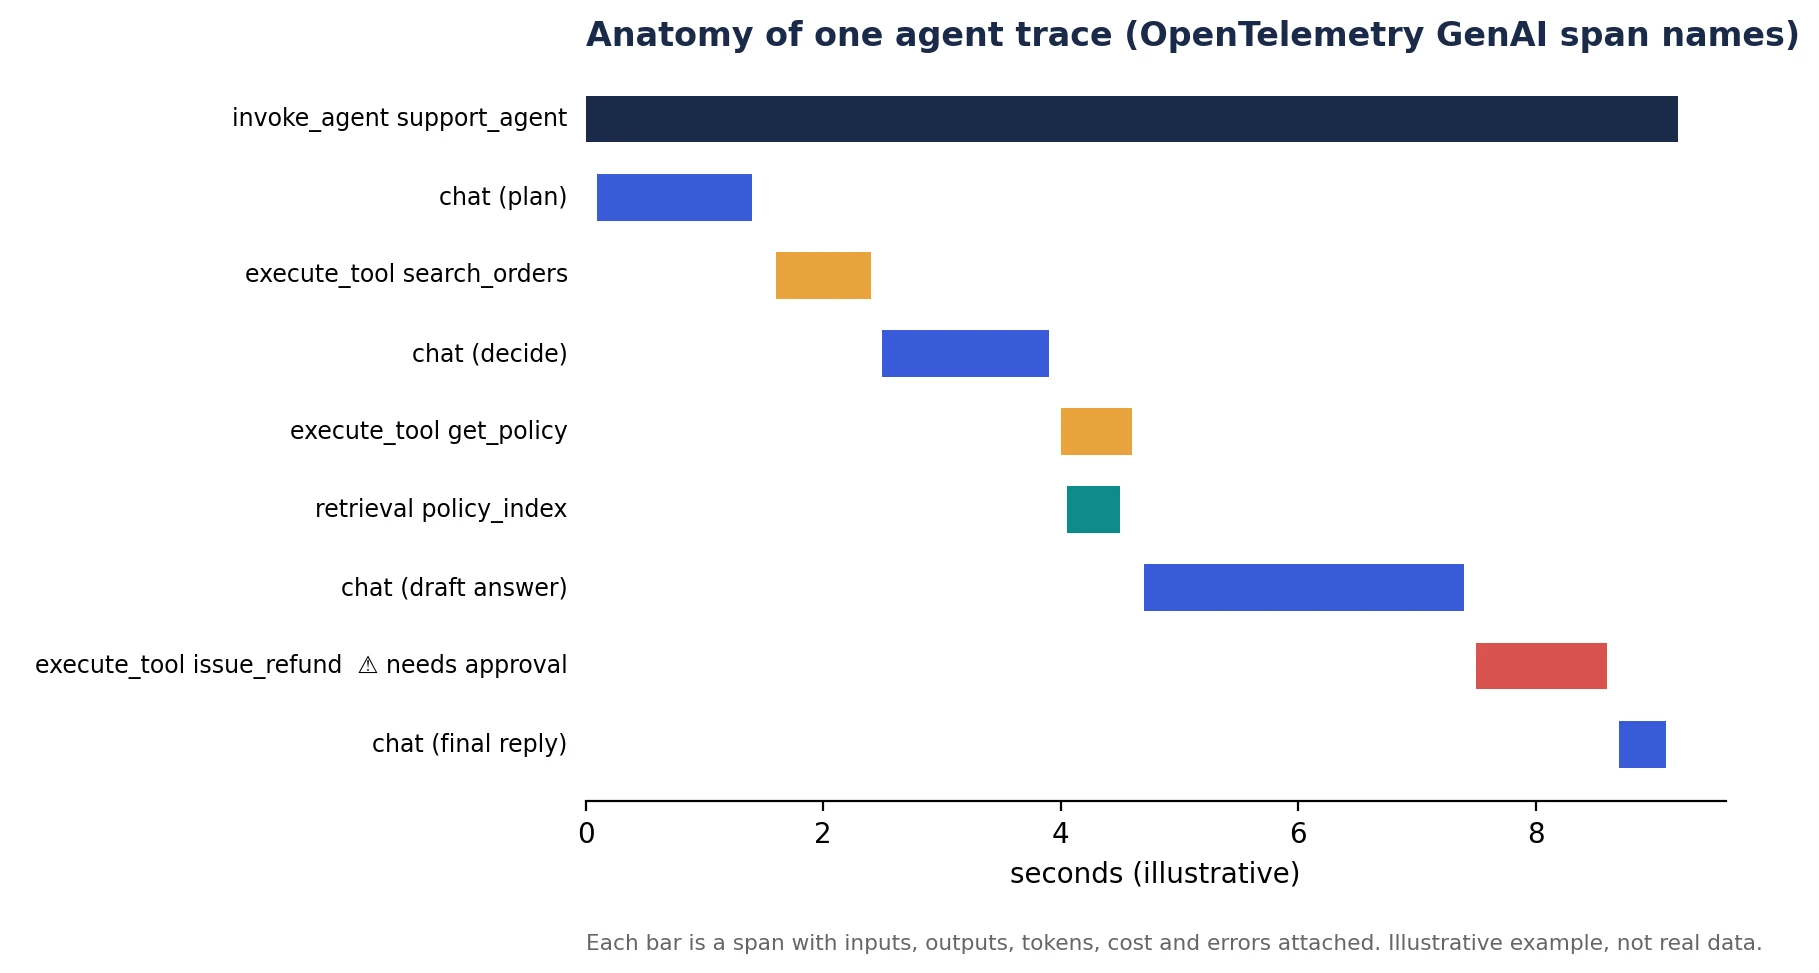 Standard naming makes traces portable between tools. OpenTelemetry’s semantic conventions for GenAI agent spans recommend naming an agent span invoke_agent followed by the agent name, and the GenAI span conventions define execute_tool spans for tool calls. Observability products including Microsoft Foundry, Honeycomb and OpenSearch already support these conventions. Microsoft’s documentation notes that the GenAI conventions have Development status and may change, so pin the version you instrument against.
For multi-agent systems, Honeycomb’s guidance is that the calling agent emits the invoke_agent span and the called agent emits its own spans under its own name, which keeps each agent’s work separately traceable.
How Do AI Agents Fail in Production?
Most agent failures do not throw exceptions. They show up as patterns in traces, which is why behavioral monitoring matters.
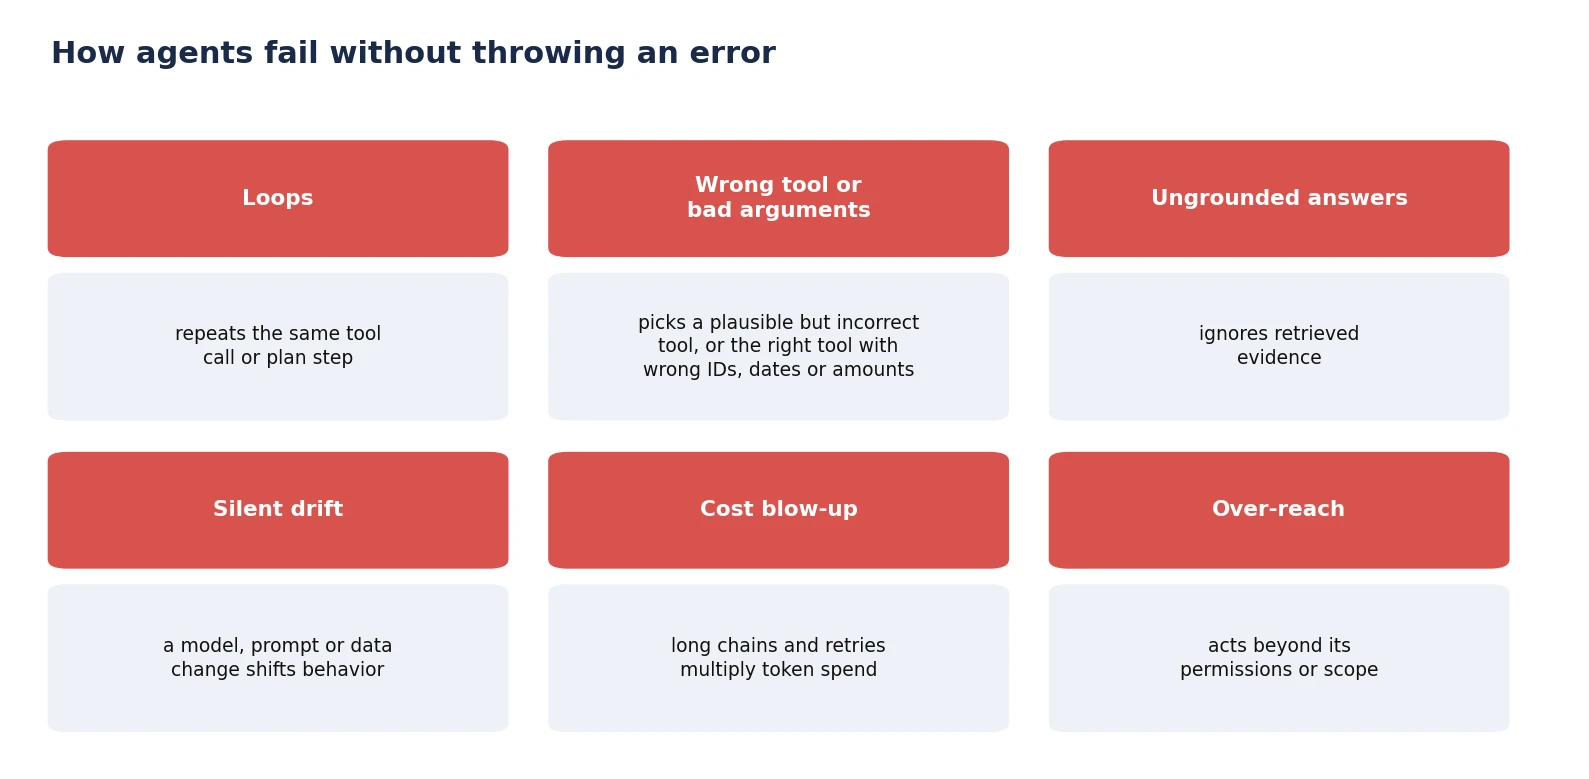
| Failure mode | Signal in traces | Typical fix |
| Loops | Same tool and arguments repeated within one trace | Step limits, loop detection, better stop conditions |
| Wrong tool or bad arguments | Tool errors, empty results, or valid calls followed by corrections | Clearer tool descriptions, schema validation, examples |
| Ungrounded answers | Answer content not supported by retrieved documents | Groundedness scoring, retrieval fixes, citation requirements |
| Silent drift | Quality or cost shifts after a model, prompt or data change | Version tagging on every span, release gates, comparison dashboards |
| Cost blow-up | Long-tail traces with very high token counts | Per-task budgets, alerts on p95 cost, caching |
| Over-reach | Actions outside scope or permission denials | Least-privilege tools, approval steps, audit logs |
Retrieval problems deserve their own monitoring for agents that search knowledge bases; AB Ark covers those in why RAG systems fail in production.
Talk to Our Team About Your Project →
How Do You Measure Agent Quality in Production?
Measure agent quality with three complementary signals, because none is reliable alone.
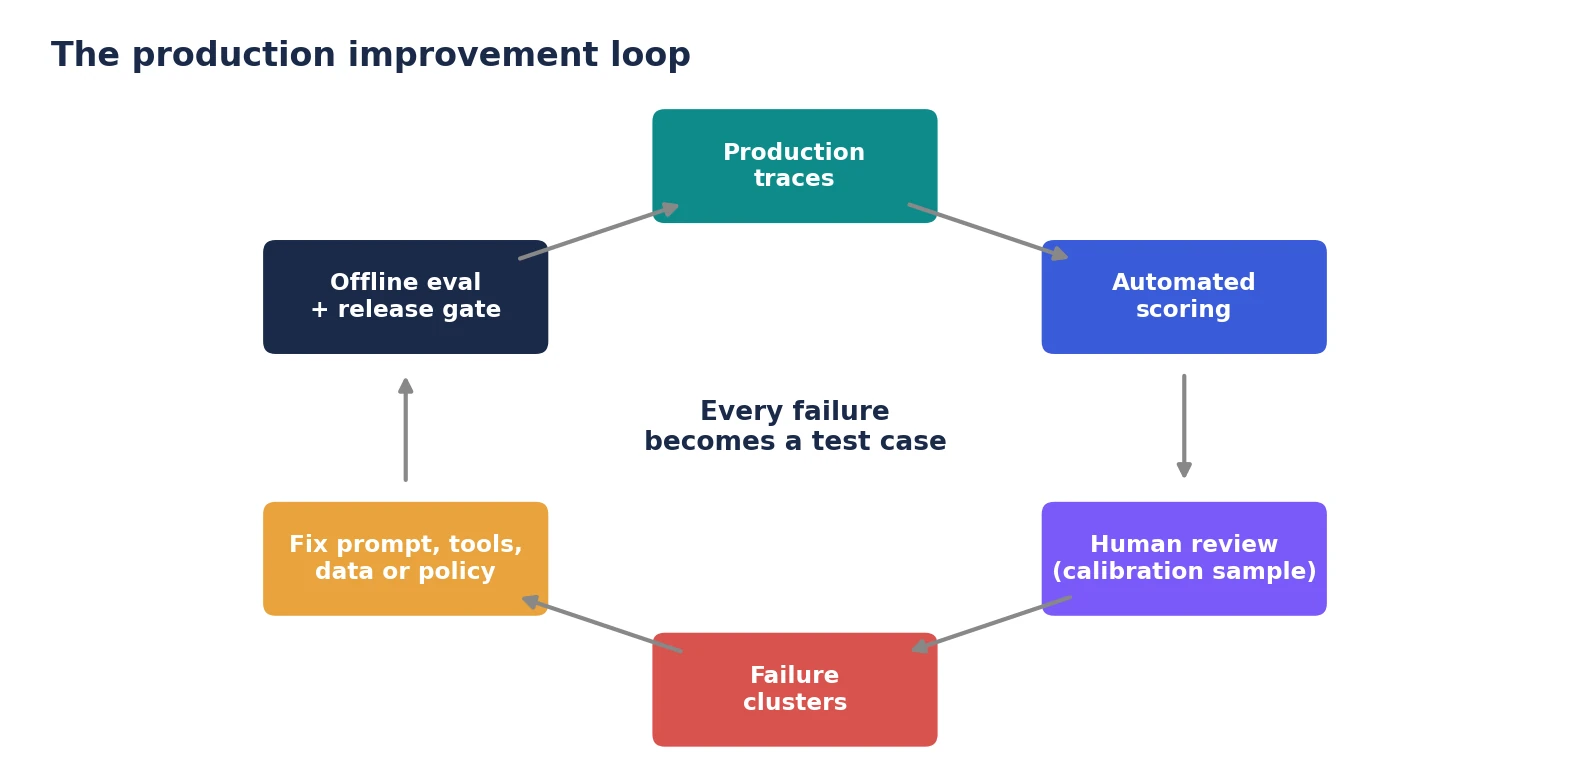
Automated scoring on every trace: an evaluator model or rules engine scores task success, correctness, groundedness, tone and policy compliance. This gives full coverage that manual QA cannot; Fin notes that human QA typically samples only 1% to 5% of conversations.
Human review of a calibration sample: experts regularly review a slice of scored traces, especially low scores and high-risk actions, to check that the automated scores agree with human judgment.
User and business signals: thumbs up or down, reopened tickets, escalations, refunds and repeat contacts show whether “success” held up in reality.
The output of all three should feed one loop: failures are clustered, fixed, turned into regression tests and checked before the next release.
 What Should Trigger an Alert?
Alert on changes in behavior and outcomes, not only on errors. A practical starting set:
| Alert | Why |
| Tool-call failure rate above baseline | Integrations or tool schemas may have changed |
| Steps per task or repeated calls rising | Loops or planning regressions |
| p95 cost per task above budget | Cost blow-ups hidden by averages |
| Quality score drop after a release or model change | Silent drift |
| Any blocked high-risk action or PII detection | Safety incidents need human eyes immediately |
| Escalation rate spike on a topic | Knowledge gap or new customer issue |
Tag every span with the agent version, prompt version, model name and tool versions. Without those tags, a quality drop cannot be traced to its cause.
How Do You Handle Privacy When Logging Agent Data?
Agent traces often contain customer messages, documents and tool results, which makes them sensitive data in their own right. OpenTelemetry’s GenAI conventions treat recording message content as a separate, deliberate choice rather than a default. In practice, teams should redact or hash personal data before export, restrict who can view full traces, set retention periods, and keep traces in the same jurisdiction as the underlying data.
How Do You Implement AI Agent Observability?
Roll out observability in stages, starting before the agent goes live:
- Instrument tracing from day one: emit OpenTelemetry GenAI spans for every agent run, model call, tool call and retrieval, with version tags.
- Define what good looks like: write explicit criteria for task success, correct escalation, tone and policy compliance for each use case.
- Build dashboards per layer: operations and cost first, then behavior, quality, safety and business metrics.
- Add automated scoring and a calibration routine: score every trace and review a sample with humans on a fixed schedule.
- Set alerts and a release gate: block deployments that lower quality scores on a regression test set built from real failures.
- Review weekly: cluster failures, prioritize by volume, cost and risk, and feed fixes back into prompts, tools, data and policies.
Teams designing new agents with AB Ark’s agentic AI development service can build these hooks in from the start, which is far cheaper than retrofitting them after an incident.
Should You Build or Buy an Agent Observability Stack?
Most teams combine both. Because the OpenTelemetry GenAI conventions are supported by several observability platforms, you can instrument once and choose or change the backend later. Buy when you need fast setup, built-in evaluation and dashboards; build or self-host when data residency, cost at high volume or custom evaluation logic matter more. Whatever you choose, avoid instrumentation that only works with one vendor’s SDK.
FAQs
What is AI agent monitoring?
AI agent monitoring is tracking an AI agent’s performance in production, including latency, cost, tool usage, task success, safety and business outcomes, across every run rather than a sample.
What is the difference between AI agent monitoring and observability?
Monitoring tracks known metrics and alerts when they move. Observability lets you investigate any single outcome through traces of each model call, tool call and decision, so you can find the root cause.
What metrics matter most for AI agents?
Cost per completed task, task success or resolution quality, tool-call success, steps per task, escalation rate and safety events. Resolution rate alone can hide wrong answers.
Can I use OpenTelemetry for AI agents?
Yes. OpenTelemetry has GenAI semantic conventions with span types such as invoke_agent and execute_tool, and several observability platforms support them. The conventions are still in development, so pin the version you use.
How often should AI agents be evaluated?
Continuously. Score every production trace automatically, review a human calibration sample regularly, and re-run regression tests before every model, prompt or tool change.
An agent you cannot trace is an agent you cannot trust at scale. Instrument every step, score every outcome, and turn every failure into a test.

Head Of Product